📊 Odds, Log-Odds, and Odds Ratio
Part I: Foundations
1. Probability vs Odds
Why do statisticians use "odds" when probability seems simpler and more intuitive?
This section answers that question by building from basic definitions to the motivation for using odds.
1.1 What is Probability?
Definition: Probability measures the likelihood of an event occurring as a fraction of all possible outcomes.
Properties:
- Range:
(or 0% to 100%) - Always expressed as a fraction of the total
Example: Rolling a die
or 16.7% or 83.3%
1.2 What are Odds?
Definition: Odds compare the number of times an event occurs to the number of times it does NOT occur.
Properties:
- Range:
(unbounded on the upper end) - Expressed as a ratio (e.g., "5 to 3" or "5:3")
- Can be greater than 1 (unlike probability)
Example: Sports Betting
"The odds in favor of my team winning are 5 to 3"

This means:
- Out of 8 similar scenarios, team wins 5 times and loses 3 times
(62.5%) (37.5%)
1.3 Key Difference: Probability vs Odds
| Aspect | Probability | Odds |
|---|---|---|
| Definition | Favorable / Total | Favorable / Unfavorable |
| Range | ||
| Example (Win 5, Lose 3) | ||
| Interpretation | "62.5% chance of winning" | "5 to 3 odds in favor" |
| Use Case | General understanding | Betting, logistic regression |
🚫 Odds ≠ Probability
- Probability =
(denominator includes event) - Odds =
(denominator excludes event)
1.4 Converting Between Probability and Odds
From Probability to Odds:
where
Example: Sports Betting (Contd)
- As seen above:
- Probability of loss is overall probability minus probability of winning.
This proves ➛
From Odds to Probability:
Example Conversions:
| Probability |
Odds Calculation | Odds Value | Interpretation |
|---|---|---|---|
| 0.5 | 1 | Even odds (1:1) | |
| 0.75 | 3 | 3 to 1 in favor | |
| 0.25 | 0.33 | 1 to 3 against | |
| 0.8 | 4 | 4 to 1 in favor | |
| 0.2 | 0.25 | 1 to 4 against |
Verification Example:
- Given:
- Calculate:
✓
1.5 Why Use Odds Instead of Probability?
Problem with Probability: Probabilities are bounded between 0 and 1, which creates asymmetry:
(strong favor) is only 0.4 units from (neutral) (strong against) is also 0.4 units from (neutral) - But 90% vs 10% feels much more extreme than the numbers suggest
Advantage of Odds: Odds are symmetric around 1:
- Odds = 9 (9:1 in favor) means 9 times more likely to occur
- Odds = 1/9 = 0.11 (1:9 against) means 9 times more likely NOT to occur
- These are reciprocals.
However, Odds Still Have Asymmetry:
- Odds in favor: 1 to 6 → Odds =
- Odds in favor: 6 to 1 → Odds =
- Distance from neutral (1):
vs ❌ Not symmetric!
Solution: Use Log-Odds to achieve perfect symmetry! � See Section 2
2. Log-Odds (Logit Function)
2.1 Definition
Log-Odds (also called logit) is the natural logarithm of the odds.
This is called the logit function:
2.2 Why Log-Odds? The Symmetry Solution
Taking the logarithm of odds creates perfect symmetry:
Example:
-
Odds against (1 to 6): Odds =
-
Odds in favor (6 to 1): Odds =
Key Insight: The distance from the origin (0) is now exactly the same (1.79) for both scenarios! This symmetry is crucial for statistical modeling.
2.3 Properties of Log-Odds
| Property | Description |
|---|---|
| Range | |
| Neutral Point | 0 (when Odds = 1, meaning |
| Symmetry | |
| Additivity | Log-odds differences correspond to odds ratios |
| Linearity | Perfect for linear modeling (logistic regression) |
Explain "Symmetry" of Log-Odds
Property: Log-odds differences correspond to multiplication (odds ratios).
This property means that switching your perspective from "winning" to "losing" changes the sign of the log-odds, but the absolute value stays exactly the same.
- Team wins 5 times and loses 3 times
Explain "Additivity" of Log-Odds
Property: Log-odds differences correspond to multiplication (odds ratios).
Logarithms turn multiplication into addition, and division into subtraction. In statistics, when you want to compare the odds of two different groups, you look at the Odds Ratio. Because of additivity, subtracting two log-odds values is mathematically identical to taking the logarithm of their odds ratio.
Let's introduce a second team to see this in action:
- Your original Team (Team A): Wins 5, Loses 3.
- A rival Team (Team B): Wins 7, Loses 1.
If we want to know how much better Team B is compared to Team A, we can do it two ways:
- Using Odds (Division): Find the Odds Ratio.
Team B's odds are
- Using Log-odds (Subtraction): Subtract Team A's log-odds from Team B's log-odds.
To see the additivity connection, if you take the logarithm of the Odds Ratio (4.2), you get the exact same number: $$log(4.2)=0.6232$$Why this matters:
In logistic regression models, this property allows us to change an outcome by simply adding coefficients (e.g.,
2.4 Comprehensive Conversion Table
| Probability |
Odds | Log-Odds (logit) | Interpretation |
|---|---|---|---|
| 0.01 | 0.0101 | -4.60 | Extremely unlikely |
| 0.1 | 0.111 | -2.20 | Very unlikely |
| 0.25 | 0.333 | -1.10 | Unlikely |
| 0.5 | 1.0 | 0 | Neutral (50-50) |
| 0.75 | 3.0 | 1.10 | Likely |
| 0.9 | 9.0 | 2.20 | Very likely |
| 0.99 | 99.0 | 4.60 | Extremely likely |
Visual Pattern: Notice how log-odds are symmetric around 0:
→ logit = -1.10 → logit = +1.10
2.5 Calculating Log-Odds (Example)
Given: Team wins 5 times, loses 3 times (from earlier example)
Step 1: Calculate probability
Step 2: Calculate odds
Or alternatively:
Step 3: Calculate log-odds
Interpretation:
- A log-odds of 0.51 indicates the event is more likely to occur than not (positive value)
- The event is
times more likely to occur than not occur
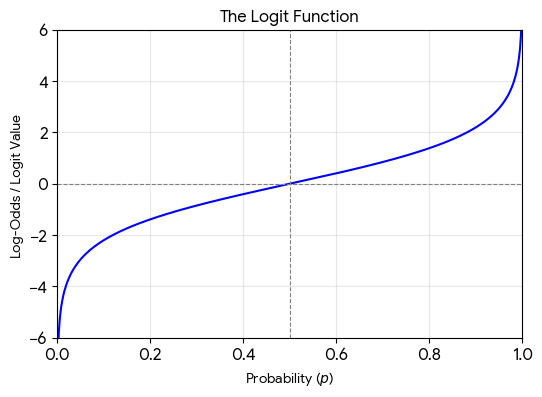
2.6 The Logit Function in Context
Mathematical Overview of Logit functions
- Input range:
representing standard probabilities. - Output range:
, spanning all real numbers. - Symmetry: It passes exactly through
where the odds are even . - Asymptotes: As
approaches , the logit approaches as approaches , it approaches .
The logit function is the foundation of logistic regression:
Why this matters:
- Left side: Log-odds (unbounded:
to ) - Right side: Linear combination (also unbounded)
- This allows us to model probabilities using linear equations!
Inverse (Sigmoid Function):
This is why the sigmoid function appears in logistic regression!
3. Odds Ratio
Now that we understand what odds are and why log-odds are useful, we need a way to compare odds between two groups. This is where the odds ratio comes in.
3.1 Definition
Odds Ratio (OR) compares the odds of an event occurring in two different groups.
Purpose: Measure the strength of association between an exposure (e.g., treatment, risk factor) and an outcome (e.g., disease, success).
3.2 Interpreting Odds Ratios
| Odds Ratio | Interpretation |
|---|---|
| OR = 1 | No association (exposure doesn't affect outcome) |
| OR > 1 | Positive association (exposure increases odds of outcome) |
| OR < 1 | Negative association (exposure decreases odds of outcome) |
| OR = 2 | Exposure doubles the odds of outcome |
| OR = 0.5 | Exposure halves the odds of outcome |
| OR = 3 | Exposure triples the odds of outcome |
3.3 Example: Smoking and Lung Cancer
Scenario: Study of 1000 people
| Lung Cancer | No Lung Cancer | Total | |
|---|---|---|---|
| Smokers | 80 | 120 | 200 |
| Non-smokers | 20 | 780 | 800 |
| Total | 100 | 900 | 1000 |
Step 1: Calculate odds for each group
- Odds (Smokers): (Odds of person having Cancer, Given he is Smoker)
- Odds (Non-smokers): (Odds of person having Cancer, Given he is Non-Smoker)
Step 2: Calculate Odds Ratio
Interpretation: Smokers have 26 times higher odds of developing lung cancer compared to non-smokers.
3.4 Odds Ratio in Case-Control Studies
Odds ratios are particularly useful in retrospective studies (case-control studies) where you:
- Start with cases (people with disease) and controls (people without)
- Look backwards to see exposure rates
Why not use Relative Risk?
- In case-control studies, you can't calculate disease incidence (you artificially selected cases)
- Odds ratio approximates relative risk when disease is rare
- Odds ratio is always calculable from 2×2 tables
4. Log-Odds Ratio
Just as we transformed odds to log-odds for better mathematical properties, we do the same for odds ratios.
4.1 Definition
Log-Odds Ratio (also called log OR) is the natural logarithm of the odds ratio.
Equivalently:
4.2 Why Use Log-Odds Ratio?
Advantages over regular Odds Ratio
-
Symmetry:
- OR = 2 means doubling risk (Case: Odds of 2 wins and 1 loss)
- OR = 0.5 means halving risk (Case: Odds of 1 wins and 2 loss)
- But 2 and 0.5 are NOT symmetric around 1
and ARE symmetric around 0!
-
Additivity:
- Combining multiple effects: add log-odds ratios
- Example: Effect A (log-OR = 0.5) + Effect B (log-OR = 0.3) = Combined (log-OR = 0.8)
-
Statistical Properties:
- Log-OR is approximately normally distributed (good for statistical tests)
- Confidence intervals are symmetric on log scale
- Easier to work with in regression models
-
Effect Size Interpretation:
- Positive log-OR: increased odds
- Negative log-OR: decreased odds
- Zero log-OR: no effect
4.3 Interpreting Log-Odds Ratios
| OR | Log-OR | Interpretation |
|---|---|---|
| 0 | Impossible in exposed group | |
| 0.14 | -2.0 | 86% reduction in odds |
| 0.37 | -1.0 | 63% reduction in odds |
| 0.5 | -0.69 | Halves the odds |
| 1 | 0 | No effect |
| 2 | 0.69 | Doubles the odds |
| 2.72 | 1.0 | 172% increase in odds |
| 7.39 | 2.0 | 639% increase in odds |
| Certain in exposed group |
4.4 Example Calculation
Using our smoking example where OR = 26:
Interpretation:
- A log-odds ratio of 3.26 indicates a very strong positive association
- The effect is
times - This is 3.26 standard deviations away from no effect (log-OR = 0)
Summary
Key Takeaways
-
Probability vs Odds: Different ways to express likelihood
- Probability: fraction of total
- Odds: ratio of favorable to unfavorable
-
Log-Odds (Logit): Transforms [0,1] to (-∞,+∞)
- Creates symmetry
- Foundation of logistic regression
- Makes effects additive
-
Odds Ratio: Measures association strength
- OR = 1: No association
- OR > 1: Positive association
- OR < 1: Negative association