Multivariate Distributions
- A multivariate random variable is a variable that consists of two or more random variables. It represents a collection of random outcomes, each corresponding to one of the component random variables.
- For example, consider a dataset containing the heights and weights of individuals. Here, height and weight are two random variables, and together they form a multivariate random variable representing each individual's height and weight pair.
- In general, a multivariate random variable can have any number of component random variables. It is often denoted as a vector, where each element of the vector represents one of the component random variables.
What is Covariance?
Covariance is a statistical term that refers to a systematic relationship between two random variables in which a change in the one reflects a change in other variable.
Covariance and correlation measure the relationship and the dependency between two variables.
I. Covariance tells us the Direction
- A positive covariance indicates that as one variable increases, the other tends to increase as well.
- A covariance of zero indicates no linear relationship between the variables.
- A negative covariance indicates that as one variable increases, the other tends to decrease.
II. Measured on a scale
- The covariance value can range from is
to - The greater this number, the more reliant the relationship.
III. Formula
- The Variance of a random variables, X is also given by
- The covariance between two random variables, X and Y is also given by
where
IV. Covariance Matrix
- The concept of variance changes, instead of a scalar quantity, we have a matrix quantity called the covariance matrix.
- A covariance matrix is always a square matrix.
- The diagonal elements represent the variance of a dataset and the off-diagonal terms give the covariance between a pair of datasets.
V. Properties
- Symmetric
- Real values
VI. Application
Covariance Matrix is mainly used in Principal Component Analysis (PCA)
What is Correlation?
Correlation is a measure that determines the degree to which two or more random variables move in sequence.
I. Types:
- Positive Correlation: When both variables move in same direction Eg: Study time 📈 Scores 📈
- Negative Correlation: When the variables move in opposite direction Eg: Temperature 📈 Hot beverage sales 📉
II. Measured on a scale
Correlation values are standardized.
- Correlation coefficient of two variables by dividing the covariance of these variables by the product of the standard deviations of the same values.
- Standard deviation measures the absolute variability of a data set’s distribution.
- When you divide the covariance values by the standard deviation, it essentially scales the value down to a limited range of -1 to +1.
- Value of 1 → Perfect Positive correlation.
- Value of -1 → Perfect Negative correlation.
- value of 0.0 → No linear relationship between two variables.
III. Formula
IV. Correlation Matrix
Why do we divide the covariance by the standard deviations to derive Correlation?
To understand why, we have to look at what each part of the formula actually does.
1. Covariance tells us the Direction
Covariance measures how two variables move together.
- If
goes up and goes up, covariance is positive. - If
goes up and goes down, covariance is negative.
The Problem: Covariance is "unscaled." Its value depends entirely on the units of measurement. If you calculate the covariance of heights and weights in meters and kilograms, you get a small number. If you switch to feet and pounds, the covariance number becomes massive, even though the relationship between the people hasn't changed.
2. Standard Deviation tells us the Scale
The standard deviations (
3. The Division "Normalizes" the Data
By dividing the covariance by the product of the standard deviations, we are essentially canceling out the units.
Think of it like this:
- Numerator: The joint variability of
and (Units: ). - Denominator: The individual variability of
and (Units: ).
When you divide them, the units cancel out completely, leaving you with a pure number. This process is called Normalization or Standardization.
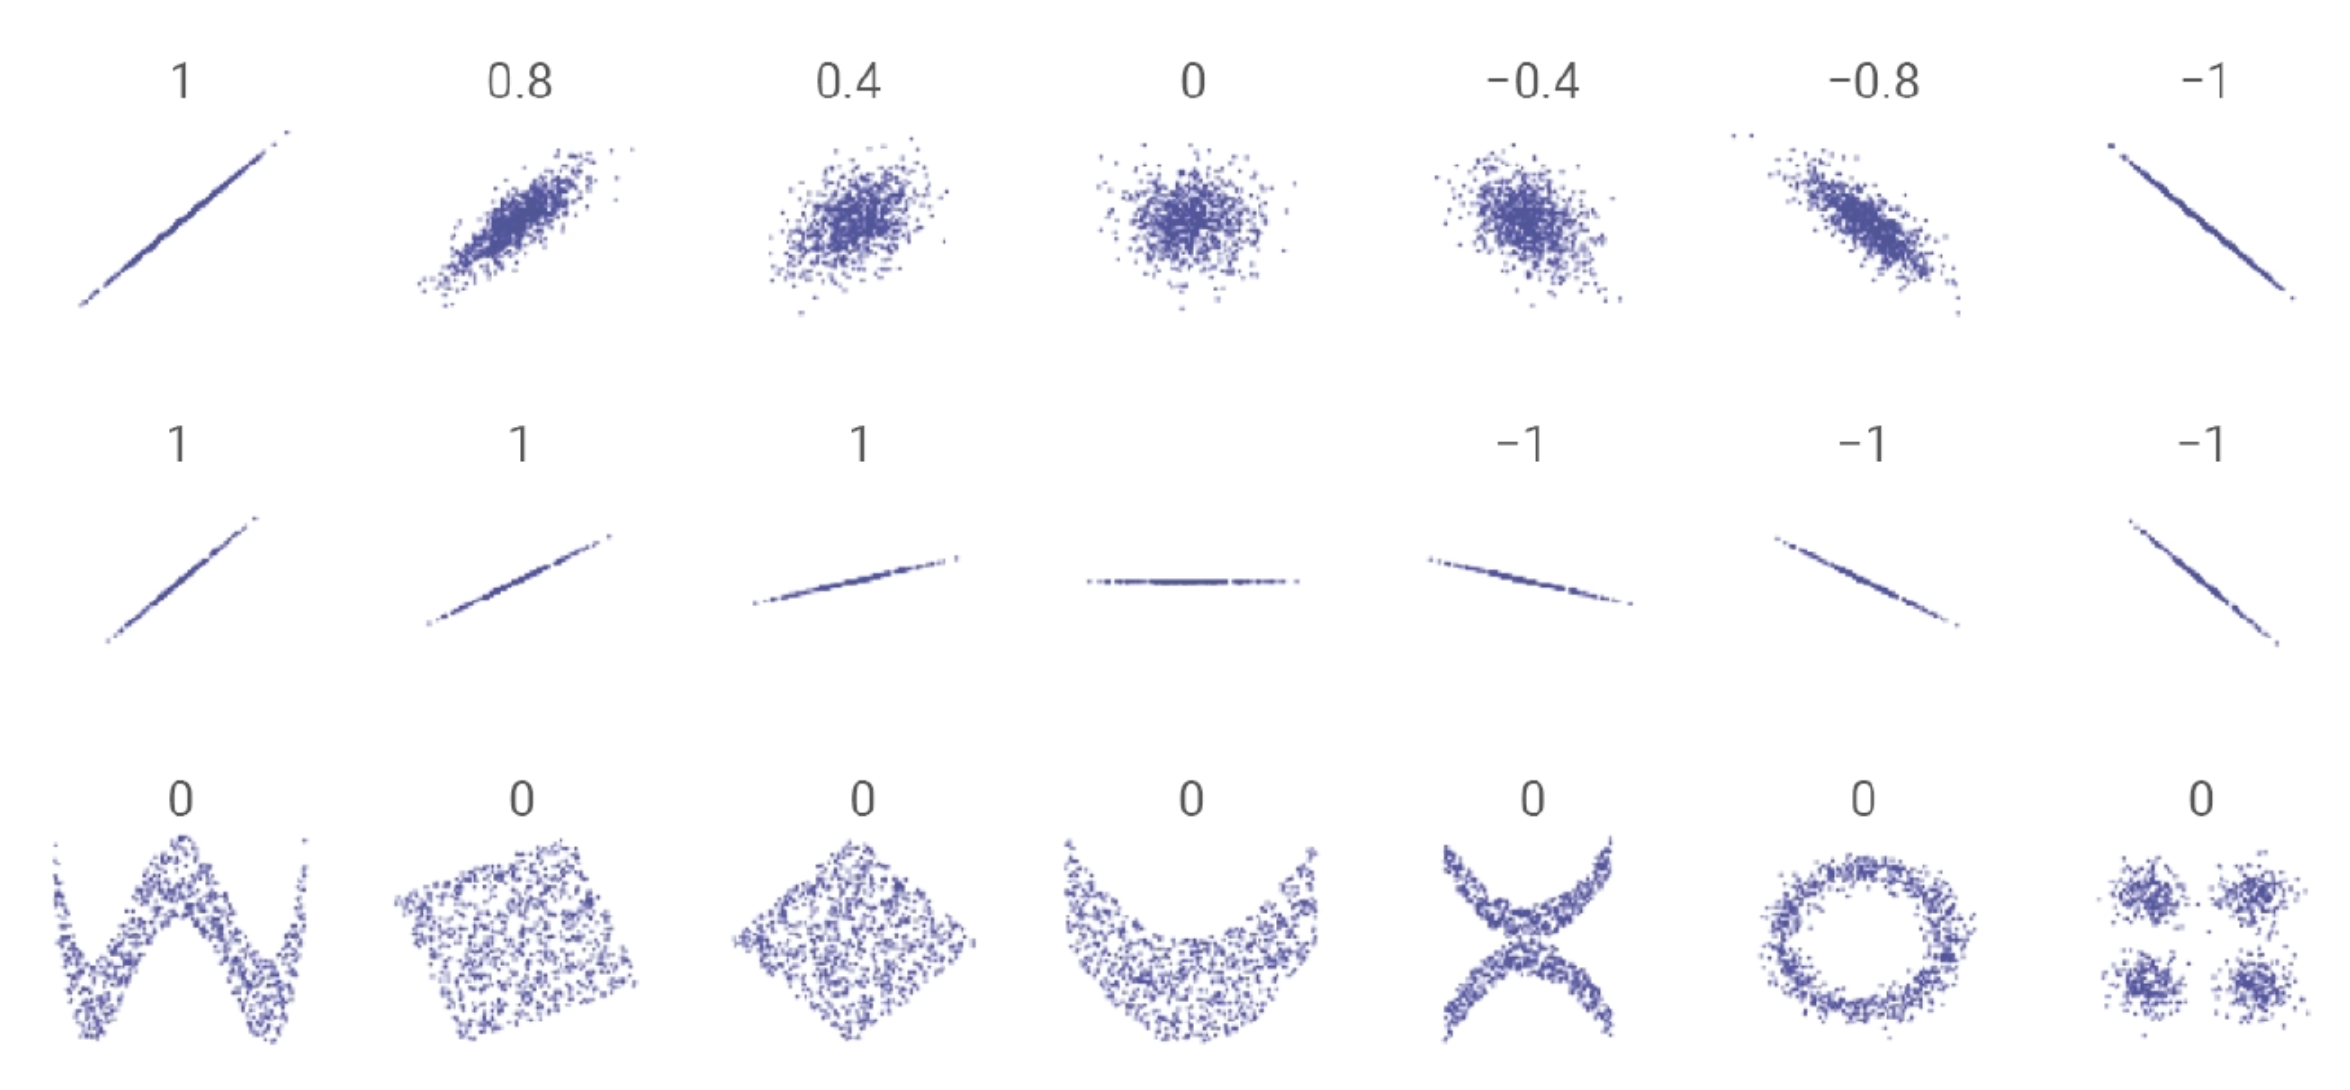
V. Data clouds and their corresponding correlation coefficients
| Parameter | Covariance | Correlation |
|---|---|---|
| Meaning | A measure of how much two random variables change together. |
A statistical measure that indicates how strongly two variables are related. |
| What is it? | Measure of Correlation | Scaled version of Covariance |
| Values | [ |
[-1, 1] |
| Change in Scale | Affects covariance | Does not effect correlation |
| Unit of Measurement | Measured in the product of the units of the two variables. |
It is a dimensionless unit (no units) |
| Goal | To find the direction of the relationship. | To find the strength and direction of the relationship. |
| Formula |
》 Refer R-Square for R-Squared vs. Correlation (