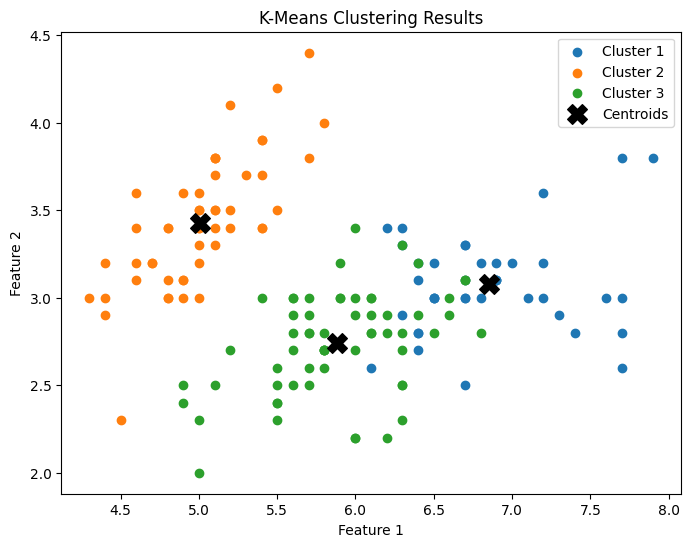
Clustering ➛ "Evaluation"
Unlike supervised learning, in unsupervised learning we do not have truth labels, making evaluation more challenging. Thus we need alternate internal validation metrics that assess cluster's quality based on geometric properties.
Overview of Evaluation Metrics
Clustering evaluation metrics generally focus on two key aspects:
- Cohesion (Compactness): How close are points within the same cluster?
- Separation: How distinct are different clusters from each other?
Main Evaluation Metrics:
- Sum of Squared Error (SSE)
- Silhouette Score
- Dunn Index
- Davies-Bouldin Index
- Calinski-Harabasz Index
1. Sum of Squared Error (SSE)
Also known as ➛ Within-Cluster Sum of Squares (WCSS)
The Sum of Squared Error (SSE), quantifies the compactness of clusters by measuring the total squared distance between each point and its cluster centroid.
Key Characteristics:
- Lower SSE = Better clustering (more compact clusters).
- Primary metric for K-Means optimization.
- Used in the Elbow Method to find optimal number of clusters.
Formula:
1. Cluster Centroid (
Where:
: The centroid of the cluster ( ) : Number of data points in cluster ( ) : Data points belonging to cluster ( )
2. Sum of Squared Errors (SSE)
Where:
: Total number of clusters : The cluster : Euclidean distance between the centroid and a point within cluster . : Sum of squared errors, which measures intra-cluster variability
➢ Interpretation & Usage:
- Lower SSE: Points are closer to their centroids → more compact clusters
- Higher SSE: Points are spread out → loose clusters
- SSE always decreases as K increases (adding more clusters always reduces SSE). Used in the Elbow Method to find optimal number of clusters.
Advantages:
- Simple and intuitive
- Fast to compute
- Directly optimized by K-means algorithm
Disadvantages:
- Always decreases with more clusters (need elbow method)
- Sensitive to outliers
- Only measures compactness, not separation
- Assumes spherical clusters of similar sizes
2. Silhouette Score
The Silhouette Score is a metric used to evaluate the quality (goodness) of clustering. It measures how similar an object is to its own cluster (cohesion) compared to other clusters (separation).
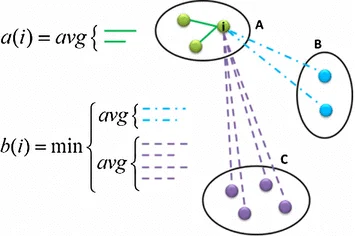
Visual representation
Formula:
1. Silhouette Score for a Single Point
Where:
: The average distance from point to all other points in the same cluster (intra-cluster distance) : The smallest average distance from point to all points in another cluster, i.e., the nearest cluster (inter-cluster distance) : Maximum of and used for normalization
2. Silhouette Score for the Entire Dataset:
To compute the silhouette score for an entire clustering solution, take the mean silhouette score
➢ Detailed Explanation:
- Cohesion (
): - Measures how similar point
is to other points within its own cluster - A lower
value indicates that point is close to its own cluster members, meaning it is well-clustered (dense cluster)
- Measures how similar point
- Separation (
): - Measures the average distance from point
to points in the nearest neighboring cluster - A higher
value indicates that point is far from other clusters, which is desirable for good clustering
- Measures the average distance from point
- Silhouette Score (
): - Combines both cohesion and separation into a single normalized metric
- When
: positive score, point is well-clustered - When
: negative score, point might belong to another cluster - When
: zero score, point is on the boundary
- Dataset Silhouette Score (
): - Average of silhouette scores of all points
- Provides an overall quality measure for the clustering solution
➢ Interpretation Guidelines:
: Strong clustering structure : Reasonable clustering structure : Weak clustering structure, some overlap : No substantial clustering structure : Points is likely misclassified.
Advantages:
- Intuitive and easy to interpret
- Considers both cohesion and separation
- Can identify misclassified points (negative scores)
- Works with any distance metric
- Can be visualized per cluster
Disadvantages:
- Computationally expensive:
for n data points - Biased towards convex clusters
- Can be misleading for complex cluster shapes (e.g., concentric circles)
- Sensitive to cluster size imbalance
= average intra-cluster distance (within cluster) = average inter-cluster distance (to nearest different cluster) - We want
to be small (tight cluster) and to be large (well-separated clusters)
3. Dunn Index
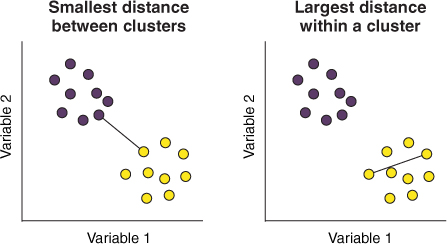
The Dunn Index is a clustering validation index used to evaluate the clustering quality.
- It analyzes the compactness and separation of clusters in a dataset.
- A higher Dunn Index indicates better clustering, as it favors clusters that are compact (low intra-cluster variation) and well-separated from one another (high inter-cluster distance).
Formula
Refer 👉 permetrics.readthedocs.io ➛ Dunn Index
Let us denote by
and
The Dunn index (
➢ Interpretation:
- Higher Dunn Index = Better clustering (well-separated and compact clusters)
- Lower Dunn Index = Poor clustering (overlapping or loose clusters)
- Range:
, but typically between 0 and 2
Advantages:
- Intuitive interpretation
- Considers both separation and compactness
Disadvantages:
- Computationally expensive for large datasets
- Sensitive to outliers
- May not work well with clusters of different sizes or densities
4. Davies-Bouldin Index (DBI)
The Davies-Bouldin Index (DBI) is a metric designed to evaluate the quality of clustering results by analyzing both the intra-cluster similarity (compactness) and inter-cluster separation (distinctiveness).
Application
- Single Metric for Quality: DBI provides a single numeric value and combines compactness and separation into a single score for cluster evaluation where lower values indicate better clustering performance
- Model Comparison: Can be used to compare the performance of different clustering algorithms on the same dataset (e.g., K-Means, DBSCAN).
- Hyperparameter Tuning: Helps in selecting the optimal number of clusters (
) by minimizing the DBI score. - Clustering Validation: Provides an objective measure to determine how well the algorithm has segmented the data.
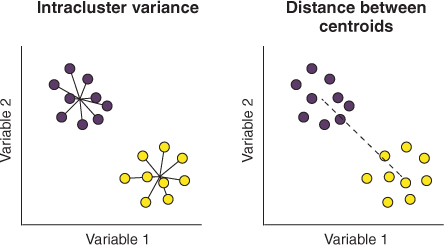
How Does DBI Work?
The Davies-Bouldin Index quantifies the ratio of:
- Intra-cluster distance (compactness):
- Measures how tightly grouped the points within each cluster are (clusters should be compact).
- Inter-cluster distance (separation):
- Measures how far apart different clusters are from each other (clusters should be well-separated).
Visual Representing
Formula:
Where:
: Number of clusters : Average distance of all points in cluster to its centroid $$S_i = \frac{1}{|C_i|} \sum_{x \in C_i} \text{dist}(x, c_i)$$ : Distance between centroids of clusters and - The
ensures that we use the "worst case" (most similar pair of clusters).
Interpretation:
- Lower DBI = Better clustering (compact clusters that are far apart)
- Higher DBI = Poor clustering (scattered or overlapping clusters)
- Range:
Advantages:
- Faster to compute than Dunn Index
- Considers all clusters, not just extremes
- The low complexity and interpretability of DBI make it an important clustering evaluation metric
Disadvantages:
- Assumes clusters are convex and isotropic
- Biased towards spherical clusters
5. Calinski-Harabasz Index (Variance Ratio Criterion)
The Calinski-Harabasz Index (also known as the Variance Ratio Criterion) evaluates clustering based on the ratio of between-cluster variance to within-cluster variance.
Formula:
Where:
: Number of clusters : Total number of data points : Between-cluster sum of squares (variance between clusters) : Within-cluster sum of squares (same as SSE) : Global centroid (mean of all data points) : Centroid of cluster
Interpretation:
- Higher CH Index = Better clustering (tight, well-separated clusters)
- Lower CH Index = Poor clustering
- No fixed range, depends on dataset
Advantages:
- Fast to compute
- Works well for convex clusters
- Can be used to find optimal number of clusters
Disadvantages:
- Biased towards convex clusters
- Not suitable for non-convex or density-based clusters
Comparison of Evaluation Metrics
| Metric | Range | Best Value | Pros | Cons | Use Case |
|---|---|---|---|---|---|
| SSE | Lower | Simple, fast | Decreases with K, no normalization | K-Means optimization | |
| Silhouette | Closer to 1 | Intuitive, considers both cohesion & separation | Slow for large datasets | General clustering evaluation | |
| Dunn Index | Higher | Intuitive, robust metric | Very slow, sensitive to outliers | Small datasets with clear separation | |
| Davies-Bouldin | Lower | Fast, intuitive | Assumes spherical clusters | Quick evaluation, spherical clusters | |
| Calinski-Harabasz | Higher | Very fast, good for finding K | Biased to convex clusters | Large datasets, finding optimal K |
Choosing the Right Metric
flowchart TD
    Start([Need to Evaluate
Clustering]) --> Q1{Large Dataset?
 >10,000 points}

    Q1 -->|Yes| Q2{Need to find
optimal K?}
    Q1 -->|No| Q3{Know cluster
shapes?}

    Q2 -->|Yes| CH[✓ Calinski-Harabasz
Fast & effective for K selection]
    Q2 -->|No| DB[✓ Davies-Bouldin
Fast evaluation]

    Q3 -->|Spherical| SIL1[✓ Silhouette Score
Best overall metric]
    Q3 -->|Arbitrary| Q4{High separation
expected?}

    Q4 -->|Yes| DUNN[✓ Dunn Index
Emphasizes separation]
    Q4 -->|No| SIL2[✓ Silhouette Score
Balanced evaluation]

    CH --> Tip1[Tip: Use with SSE
for elbow method]
    DB --> Tip2[Tip: Assumes convex
clusters]
    SIL1 --> Tip3[Tip: Computationally
intensive]
    DUNN --> Tip4[Tip: Very slow,
sensitive to outliers]
    SIL2 --> Tip5[Tip: Most reliable
for various shapes]

    style Start fill:#FFE5E5
    style CH fill:#F3E5FF
    style DB fill:#FFE5F3
    style SIL1 fill:#E5FFE5
    style SIL2 fill:#E5FFE5
    style DUNN fill:#FFF5E5
    style Tip1 fill:#F3E5FF,stroke:#9370DB
    style Tip2 fill:#FFE5F3,stroke:#DB70AB
    style Tip3 fill:#E5FFE5,stroke:#70DB70
    style Tip4 fill:#FFF5E5,stroke:#DBAE70
    style Tip5 fill:#E5FFE5,stroke:#70DB70
Best Practices for Clustering Evaluation
-
Use Multiple Metrics: Never rely on a single metric. Different metrics capture different aspects of clustering quality.
-
Consider the Context:
- For K-Means: Use SSE (Elbow method) + Silhouette Score
- For DBSCAN: Use Silhouette Score + manual inspection
- For Hierarchical: Use Dendrogram + Silhouette Score
-
Find Optimal K:
- Plot metrics for different values of K
- Look for the "elbow" in SSE
- Choose K with highest Silhouette/CH score or lowest DB score
-
Domain Knowledge:
- Metrics are tools, not absolute truth
- Validate results with domain expertise
- Consider interpretability and business value
-
Visual Validation:
- Always visualize clusters (use PCA/t-SNE for high dimensions)
- Check if clusters make semantic sense
- Look for outliers and boundary cases
-
Computational Considerations:
- Large datasets: Use CH or DB index
- Small datasets: Can afford Silhouette or Dunn index
- Real-time applications: Pre-compute metrics or use approximations