📊 Statistics: From Basics to Advanced
Welcome to your comprehensive guide to Statistics! This document combines bedrock concepts with advanced formulas to help you understand not just how to calculate, but why these measures matter.
🟢 Level 1: The Basics (Central Tendency)
These measures help us find the "center" or "typical" value in a dataset.
| Concept | Definition | Formula | Example (Data: 3, 5, 5, 7, 10, 12, 14) |
|---|---|---|---|
| Mean ( |
The average (balance point). | ||
| Median | The physical middle. | Sort & find middle | 7 |
| Mode | Most frequent value. | Count occurrences | 5 (appears twice) |
| Midrange | Halfway between ends. |
🟡 Level 2: Measuring the "Spread" (Dispersion)
Knowing the center isn't enough; we need to know if the data is tightly packed or widely scattered.
1. Range & IQR
- Range: Difference between Max and Min (
). - Interquartile Range (IQR): The span of the middle 50% of data (
). - Outlier Rule: A point is an outlier if it is:
- Below
- Above
- Below
2. Standard Deviation (
Standard deviation is the "gold standard" and that measures the spread of a data distribution. The more spread out a data distribution is, the greater its standard deviation.
- It indicates how spread out the data points are from the mean value.
- A high standard deviation indicates that the data points are more dispersed.
- A low standard deviation means that the data points are close to the mean,
| Type | Formula | When to use? |
|---|---|---|
| Population | When you have data for the entire group. | |
| Sample | When you're using a small group to estimate a big one. |
Note: We divide by
🔵 Level 3: Position & The Normal Distribution
How does one specific data point compare to the rest?
1. Z-Score (Standardization)
The Z-score tells you exactly how many Standard Deviations a point is from the mean.
: Exactly average. : (close to ) says the data point is close to average. : Higher than ~95% of the population. - A positive z-score says the data point is above average.
- A negative z-score says the data point is below average.
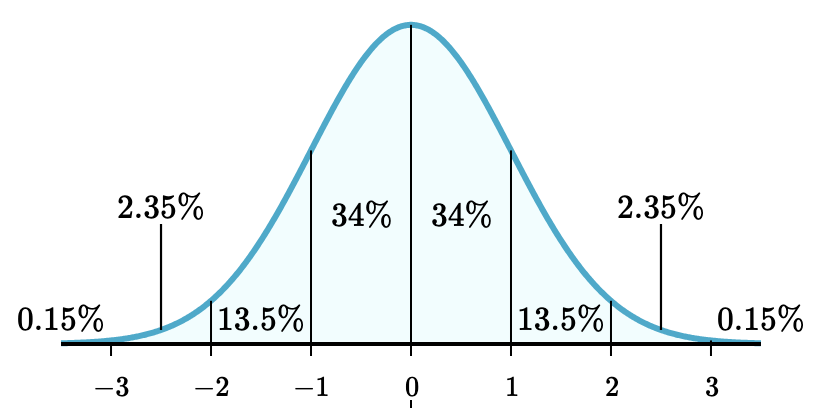
2. The Empirical Rule (68-95-99.7)
In a Normal Distribution:
- 68% of data falls within 1 SD.
- 95% of data falls within 2 SD.
- 99.7% of data falls within 3 SD.
🔴 Level 4: Advanced Relationships (Bivariate & Inference)
Moving from one variable (
1. Covariance & Correlation (
- Covariance: Tells you if two variables move together (positive) or opposite (negative).
- Correlation (
): A "standardized" covariance that always falls between -1 and 1. : Perfect positive relationship. : No linear relationship.
For in depth coverage refer Residuals
2. Standard Error (SE)
When we take samples, the means of those samples will vary. The SE tells us how much we expect that sample mean to "wiggle."
3. T-Score vs. Z-Score (Confidence Intervals)
Use these to estimate a range where the "true" population mean likely lives.
- Use Z-Score: If you know the population variance (
) and . - Use T-Score: If the population variance is unknown or your sample size is small.
📋 Quick Formula Cheat Sheet
| Measure | Formula | What it measures |
|---|---|---|
| Mean Absolute Deviation (MAD) | $$MAD = \frac{\sum_\limits{n=1}^{n}{|x_i-\mu|}}{n}$$ | Average distance from the mean (no squaring). |
| Coefficient of Variation ( |
Consistency: How big is the error relative to the mean? | |
| Standard Error ( |
The precision of your sample mean. | |
| Z-Score | Distance from mean in units of "Standard Deviation". | |
| Covariance ( |
If X goes up, does Y go up too? | |
| Correlation ( |
Strength of relationship between -1 and 1. | |
| R-Squared ( |
Refer R-Square |