Quantile Transformer
A Quantile Transformer is a powerful non-parametric preprocessing tool that transforms features to follow a specific distribution (either Uniform or Normal). Unlike the Power Transformer, which relies on a mathematical power function, the Quantile Transformer uses the rank of each data point to reshape the distribution.
I. Features
- Rank-Based Transformation: Instead of using a mathematical formula, the Quantile Transformer ranks your data and then maps those ranks to a target distribution—either Uniform (spread evenly between 0 and 1) or Normal (bell curve).
- Collapses Outliers: By mapping data to a specific range or distribution, extreme outliers are "pushed" to the edges of the distribution, effectively neutralizing their impact.
- Smoothes Distributions: It spreads out the most frequent values and reduces the distance between rare values, creating a smooth, predictable shape.
- Non-Parametric Mapping: It does not assume a specific underlying distribution (like a bell curve) before it starts; It doesn’t care what your data looks like to start with—skewed, multimodal, or weirdly shaped it simply looks at the "quantiles" (percentiles) of your actual data.
II. Best Use Cases
- Dealing with Extreme Outliers: If your data has wild outliers that other scalers (like RobustScaler) can’t handle, QuantileTransformer is a great choice.
- Non-Linear Features:
- High-dimensional data where features have different scales and non-linear relationships.
- Works well when your features have strange shapes, multiple peaks, or don’t follow a simple pattern.
- Neural Networks: Neural networks often work best when all features have similar distributions, but your input features have wildly different distributions —Quantile Transformer can make that happen.
- When You Need a Specific Output Distribution: If your model or algorithm expects features to look like a bell curve or be evenly spread, this transformer can force your data into that shape.
III. When NOT to Use It
- Small Datasets: If you have fewer than about 1,000 samples, the quantile estimates can be unreliable and may add noise instead of clarity.
- Linear Regression: If you rely on the precise linear correlation between
and , this transformer may "break" that relationship by stretching the data unevenly. - Tree-Based Models: Similar to the Power Transformer, Decision Trees and Random Forests generally don't need this level of transformation to perform well.
- Sparse Data: If your data is mostly zeros (sparse), Quantile Transformer will fill in those zeros, destroying sparsity. Use MaxAbsScaler instead.
IV. Pros
- Outlier Immunity: It is arguably the most robust scaler against extreme outliers.
- Forces Normality: If set to output_distribution='normal', thus it can make almost any data look like a perfect bell curve or spread evenly.
- Handles Complex Shapes: Excellent for multimodal (multiple peaks) or heavily skewed data where other transforms fail.
V. Cons
- Breaks Linearity: Because it’s non-linear, it can distort relationships between features and targets.
- Information Loss: Because it relies on ranking, small differences between values in high-density areas may be exaggerated, while large differences in low-density areas are squashed.
- Sample Size Sensitivity: It requires a sufficiently large number of samples to estimate quantiles accurately.
- Not Consistent Across Batches: If you fit on different batches, the transformation may not be exactly the same each time.
VI. Sample Code
import pandas as pd
from sklearn.datasets import load_wine
from sklearn.preprocessing import QuantileTransformer
import matplotlib.pyplot as plt
import seaborn as sns
# Load a public dataset
data = load_wine()
df = pd.DataFrame(data.data, columns=data.feature_names)
feature = df["alcohol"].to_numpy().reshape(-1, 1)
# Apply Quantile Transformer
qt = QuantileTransformer(output_distribution="normal", random_state=0)
transformed = qt.fit_transform(feature)
# Create subplots
fig, axes = plt.subplots(1, 4, figsize=(18, 4))
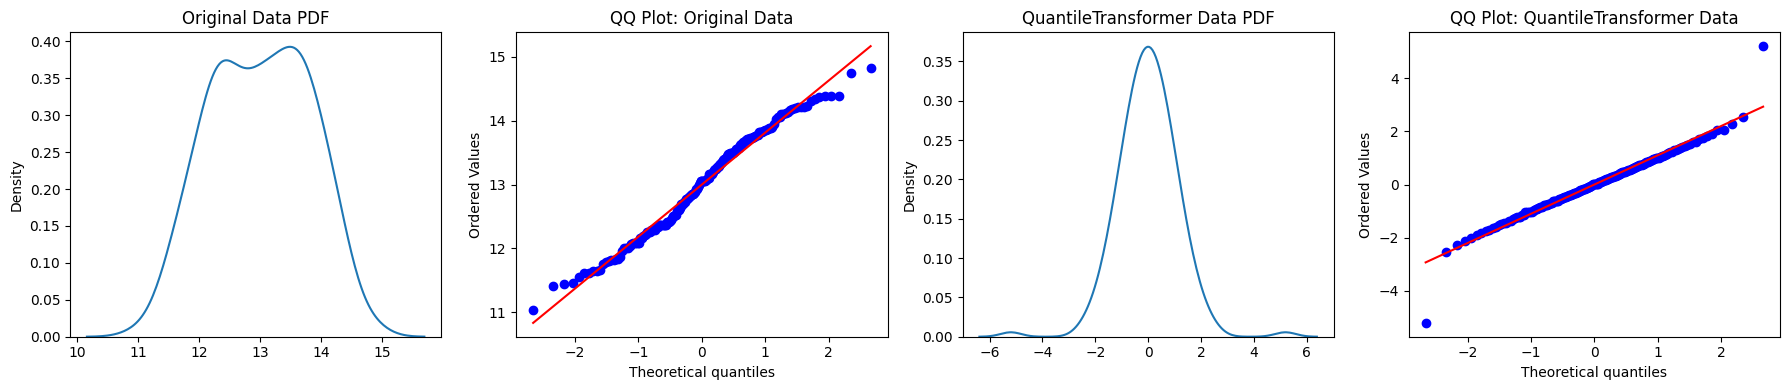
# Original Data KDE Plot
sns.kdeplot(feature.flatten(), ax=axes[0])
axes[0].set_title('Original Data PDF')
# Original Data QQ Plot
stats.probplot(feature.flatten(), dist='norm', plot=axes[1])
axes[1].set_title('QQ Plot: Original Data')
# QuantileTransformer Data KDE Plot
sns.kdeplot(transformed.flatten(), ax=axes[2])
axes[2].set_title('QuantileTransformer Data PDF')
# QuantileTransformer Data QQ Plot
stats.probplot(transformed.flatten(), dist='norm', plot=axes[3])
axes[3].set_title('QQ Plot: QuantileTransformer Data')
# Adjust layout and display
plt.tight_layout()
plt.show()