Shapiro-Wilk Test
- Most powerful test for normality, especially for smaller sample sizes (n < 5000)
- Tests the null hypothesis that data was drawn from a normal distribution
- W statistic ranges from 0 to 1 (closer to 1 = more normal)
Interpretation
- p-value > 0.05: Fail to reject null hypothesis → Data is normally distributed ✓
- p-value ≤ 0.05: Reject null hypothesis → Data is NOT normally distributed ✗
- W close to 1: Data resembles normal distribution
- W far from 1: Data deviates from normal distribution
Python Example
# Example: Test for Normality using Shapiro-Wilk Test (scipy.stats.shapiro)
from scipy.stats import shapiro
import numpy as np
import matplotlib.pyplot as plt
# Generate sample data: normal and non-normal
normal_data = np.random.normal(loc=0, scale=1, size=1000)
non_normal_data = np.random.exponential(scale=2, size=1000)
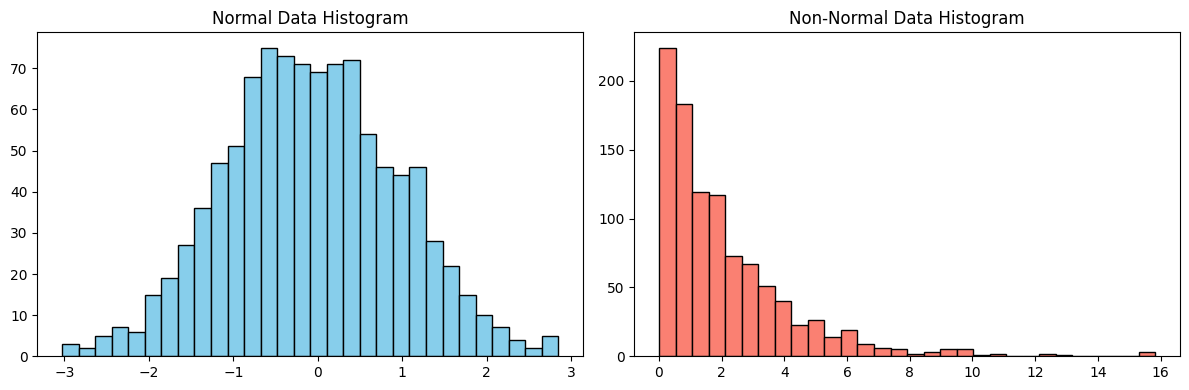
# Plot histograms for visual inspection
fig, axes = plt.subplots(1, 2, figsize=(12, 4))
axes[0].hist(normal_data, bins=30, color='skyblue', edgecolor='black')
axes[0].set_title('Normal Data Histogram')
axes[1].hist(non_normal_data, bins=30, color='salmon', edgecolor='black')
axes[1].set_title('Non-Normal Data Histogram')
plt.tight_layout()
plt.show()
# Shapiro-Wilk test for normality
stat_norm, p_norm = shapiro(normal_data)
stat_non_norm, p_non_norm = shapiro(non_normal_data)
print(f"Normal Data: Statistic={stat_norm:.4f}, p-value={p_norm:.4f}")
print(f"Non-Normal Data: Statistic={stat_non_norm:.4f}, p-value={p_non_norm:.4f}")
if p_norm > 0.05:
print("Normal Data: Likely Gaussian (fail to reject H0)")
else:
print("Normal Data: Not Gaussian (reject H0)")
if p_non_norm > 0.05:
print("Non-Normal Data: Likely Gaussian (fail to reject H0)")
else:
print("Non-Normal Data: Not Gaussian (reject H0)")
Output
Normal Data: Statistic=0.9986, p-value=0.6078
Non-Normal Data: Statistic=0.7950, p-value=0.0000
Normal Data: Likely Gaussian (fail to reject H0)
Non-Normal Data: Not Gaussian (reject H0)