Violin Plot
Purpose
Combine box plot and kernel density estimation to show distribution shape, spread, and probability density at different values.
Analysis Type
Univariate or Bivariate (across categories)
What to Look For
1. Distribution Shape
- Width at any point: Represents density/frequency of values
- Wider sections: More data points at that value
- Narrow sections: Fewer data points
2. Modality
- Single bulge: Unimodal distribution
- Multiple bulges: Bimodal or multimodal distribution
- Indicates presence of subgroups
3. Symmetry
- Symmetric violin: Normal-like distribution
- Asymmetric: Skewed distribution
4. Comparing Groups
- Compare shapes across categories
- Different shapes suggest different underlying distributions
5. Central Tendency
- White dot or line inside shows median
- Thick black bar shows IQR
6. Tail Behavior
- Long thin tails indicate extreme values
- Fat tails indicate more data in extremes
7. Linearity
- Linear
- The whole violin “slides” smoothly across ordered groups: center and bulk of density move steadily.
- Similar shape across groups, mainly shifted up/down (suggesting a consistent effect).
- Non-Linear
- Density shape changes a lot across groups (e.g., becomes bimodal only for one group), hinting interactions/thresholds.
- Middle groups overlap strongly while one end group separates sharply (classic “non-linear jump”).
Code Example
# Basic violin plot
sns.violinplot(y='value', data=df)
plt.title("Violin Plot of Variable")
plt.show()
# Grouped violin plot
sns.violinplot(x='category', y='value', data=df, hue='group')
plt.title("Value Distribution Across Categories and Groups")
plt.show()
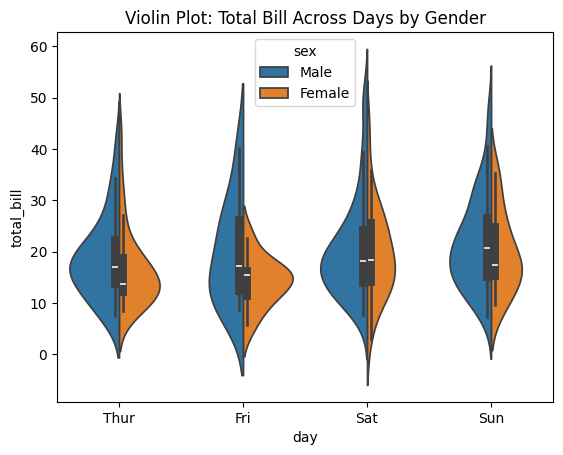
# Split violin for comparison
sns.violinplot(x='category', y='value', data=df, hue='binary_group', split=True)
plt.title("Split Violin Plot by Binary Group")
plt.show()
Pro Tip
Use inner='quartile' parameter to show quartile lines inside violins: sns.violinplot(x='cat', y='val', data=df, inner='quartile'). This combines the best of box plots (quartiles) with density visualization. For comparing two groups, use split=True with a binary hue variable to create mirror violins for easy comparison.
Documentation