Q-Q Plot (Quantile-Quantile Plot)
Purpose
Check if a variable follows a normal distribution by comparing its quantiles to theoretical normal distribution quantiles.
Analysis Type
Univariate
What to Look For
1. Normal Distribution (GOOD)
- Points fall on reference line: Data is normally distributed
- Small deviations are acceptable
- Important for many statistical tests and ML algorithms
2. Heavy Tails
- Points curve above line at ends: More extreme values than normal
- Distribution has fatter tails
3. Light Tails
- Points curve below line at ends: Fewer extreme values than normal
- Distribution has thinner tails
4. Right Skew (Positive Skew)
- Points curve above line on right: Long right tail
- Most values concentrated on left
- Solution: Apply log or square root transformation
5. Left Skew (Negative Skew)
- Points curve above line on left: Long left tail
- Most values concentrated on right
- Solution: Apply power transformation
6. S-Shape:
- Heavy tails on both ends
- May indicate mixture of distributions
7. Gaussian distribution
- Points on the diagonal line: Data is normally distributed
- S-shaped curve: Heavy tails (more extreme values than normal)
- Inverted S-curve: Light tails (fewer extreme values)
- Points curve upward on right: Right-skewed distribution
- Points curve downward on left: Left-skewed distribution
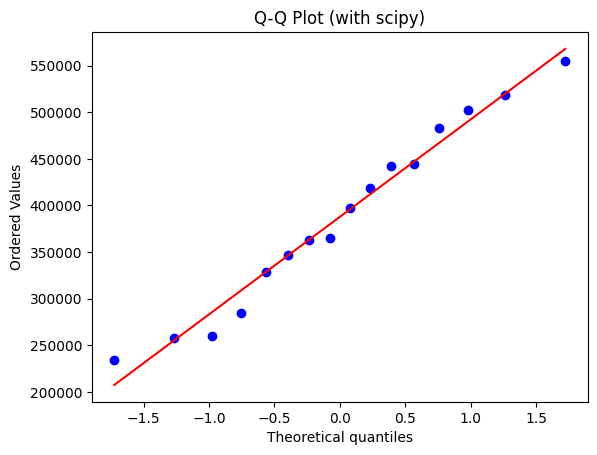
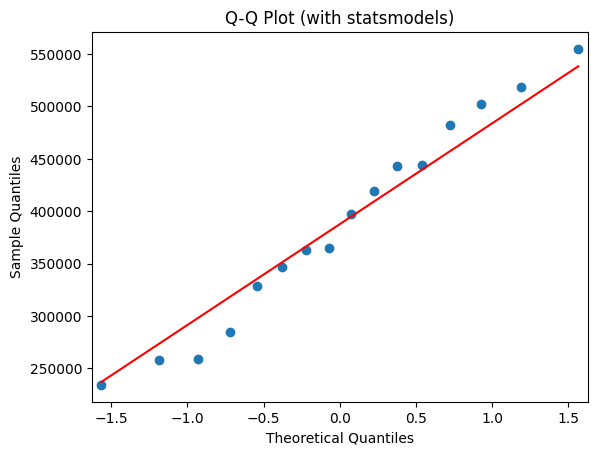
Code Example
from scipy import stats
import statsmodels.api as sm

# Load the longley dataset
data = sm.datasets.longley.load_pandas()
data = data.exog  # Use explanatory variables

# Q-Q plot
stats.probplot(data['GNP'], dist="norm", plot=plt)
plt.title("Q-Q Plot (with scipy)")
plt.show()

# Using statsmodels
sm.qqplot(data['GNP'], line='s')
plt.title("Q-Q Plot (with statsmodels)")
plt.show()
Pro Tip
Create Q-Q plots before and after transformations to verify improvement: stats.probplot(df['original'], plot=plt) vs stats.probplot(np.log(df['original']), plot=plt). If points deviate from the line at the ends (tails), try log transformation for right-skewed data, square transformation for left-skewed data, or Box-Cox transformation for general non-normality. Use with Shapiro-Wilk test for formal normality testing.
Documentation