The Bullseye Target
The Bullseye Target is the most famous visual metaphor in machine learning because it perfectly separates the two types of errors a model can make: Bias (Systemic Error) and Variance (Random Sensitivity). I personally found it worth having covered separately so we can understand each scenarios and edge cases and would help us understand the distinction much more clearly.
- Imagine the center of the bullseye is "The Truth"—the perfect mathematical relationship that exists in nature.
- Each "shot" at the target represents a model trained on a slightly different sample of data.
What is Bias and Variance?
1. Understanding Bias (The "Aim")
Bias measures how far off your average prediction is from the true value. It represents the simplifying assumptions made by a model.
★ Low Bias (Near the Center):
- On average, your shots are hitting the bullseye. This means your model is complex enough to capture the real relationship in the data. Even if individual shots are off, they are "consistently" near the bullseye.
★ High Bias (Far from Center)
- Your shots are consistently hitting the wrong part of the board (e.g., always hitting the top-right corner). This happens when a model is too simple (Underfitting). For example, trying to fit a straight line to data that is actually a curve will always be "off" by a systemic margin.
2. Understanding Variance (The "Cluster")
Variance measures the consistency of your shots. It represents how much the model's "aim" changes when you change the training data.
I have a son who is in middle school, If i had to draw parallels, here I am trying to see is, is he consistent in his Grades in all his subjects. Is he getting
★ Low Variance (Clustered Near)
Your shots are all tightly grouped together. This means the model is stable. No matter which data sample you give it, it reaches the same conclusion. It is not distracted by "noise" or random fluctuations.
★ High Variance (Scattered)
Your shots are sprayed all over the board. This happens when the model is too complex (Overfitting). Because the model is trying to "memorize" the noise in each specific data sample, every time you give it a new sample, it "learns" a completely different pattern and shoots in a different direction.
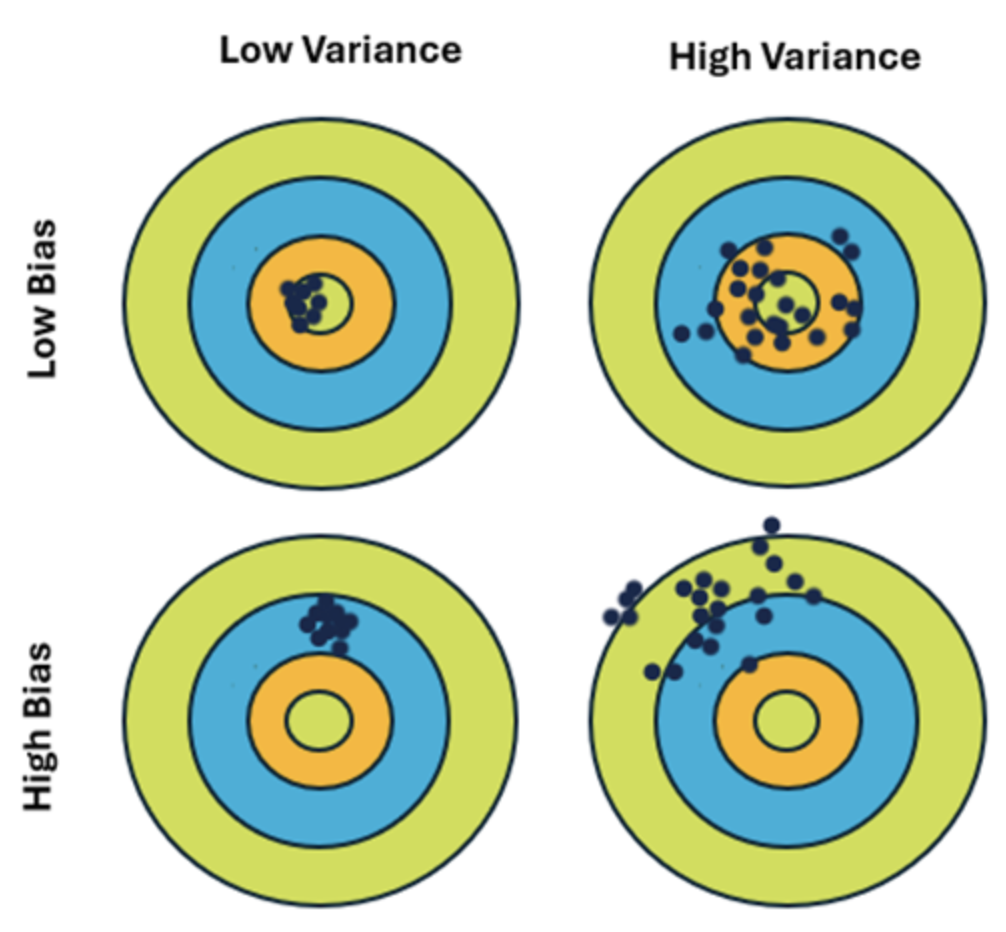
The Four Scenarios
| Scenario | Visualization | Meaning |
|---|---|---|
| Low Bias, Low Variance | Tightly clustered in the center. | The "Goldilocks" zone. The model is accurate and consistent. |
| High Bias, Low Variance | Tightly clustered, but far from center. | The model is consistent but consistently wrong. It's "reliably biased" (Underfitting). |
| Low Bias, High Variance | Scattered, but centered around the middle. | The model is right "on average," but individual predictions are wild and unstable (Overfitting). |
| High Bias, High Variance | Scattered AND far from the center. | The worst case. The model is both too simple and too sensitive to noise. |
Analogy
Using my son’s grades as the "data points," we can perfectly map out these four scenarios. In this metaphor:
- The Bullseye (
): The "True Relationship" (Perfect mastery of all subjects). - The Shots: His actual grades in different subjects (Math, Science, ELA, History).
- The Model: His "Study Habit" or "Academic Approach."
1. Low Bias & Low Variance: "The Consistent Scholar"
The Scenario: He gets an
- Low Bias: His "average" grade is right at the top. His study habit is complex enough to handle the different challenges of Math vs. ELA.
- Low Variance: His grades are tightly clustered. You don't have to worry about a surprise
in History; he is stable and predictable across the board. - The "Model": He has a deep, flexible understanding of how to learn.
2. High Bias & Low Variance: "The Consistent
The Scenario: He gets a
- High Bias: His average is far from the bullseye (
). His study habit is too simple—perhaps he only reads the first page of every chapter and stops. He is "underfitting" the curriculum. - Low Variance: He is incredibly consistent. He isn't "guessing"; he is systematically applying a simple (but failing) strategy to every subject. You know exactly what his report card will look like: a straight line of
.
3. Low Bias & High Variance: "The Moody Genius" (Overfitting)
The Scenario: He gets an
- Low Bias: If you average his grades, he’s actually doing okay (
average). He clearly has the "brainpower" (complexity) to hit the bullseye. - High Variance: His grades are scattered. This is the student who "overfits" to the teacher's personality. If he likes the Math teacher, he memorizes every tiny detail (noise) and gets an
. If he finds the Science teacher boring, his "model" falls apart and he fails. - The "Model": He is too sensitive to the "noise" (the teacher, the room temperature, the day of the week). His performance changes wildly depending on the "sample" (the subject).
4. High Bias & High Variance: "The Guessing Game"
The Scenario: He gets a
- High Bias: On average, he is far from the
bullseye. His study strategy is fundamentally flawed or non-existent. - High Variance: His grades are all over the place. There is no pattern. He isn't even "consistently mediocre"; he’s just randomly hitting different parts of the board because he hasn't learned a stable way to study.
Questions and Answers
1. Why is Low Variance "Clustered"?
In statistics, variance is the "spread." If a model has low variance, it is "stubborn." It has a strong internal logic that doesn't change easily. Whether you show it "Data Sample A" or "Data Sample B," it produces nearly the same weights and predictions. Therefore, all the "shots" (models) end up in the same spot on the board.
2. Why is High Variance "Scattered"?
High variance models are "flexible" and "reactive." If "Data Sample A" has one random outlier at the top, the model wiggles to hit it. If "Data Sample B" has an outlier at the bottom, the model wiggles the other way. Because it follows the noise (the random scatter of the dots), the models themselves become scattered.
3. Why is Low Bias "Near the Center"?
Bias is the "distance from the truth." A low-bias model has the capacity to represent the true pattern. It doesn't have "preconceived notions" (like "everything must be a straight line"). Because it is capable of seeing the truth, its predictions naturally hover around the center of the bullseye.
4. How can a model be High Bias (too simple) and High Variance (too complex) at the same time.
This happens when a model is fundamentally mismatched to the data or is trained on a tiny, poor-quality dataset.
1. The "Small Data" Trap
Imagine you are trying to predict the price of a house using only the "Color of the Front Door."
-
High Bias (Too Simple): A door's color has almost zero logical connection to a house's value. The model is too simple to capture the actual "truth" of real estate (location, square footage, etc.). It is "blind" to the real patterns, so its average prediction is consistently far from the bullseye.
-
High Variance (Too Sensitive): Because the dataset is small (say, only 5 houses), if one "Red Door" house happens to be a mansion and another "Red Door" house is a shack, the model will "panic." It will wildly change its price estimate for "Red" based on those two random examples.
Result: The model is consistently wrong (High Bias) AND its predictions swing wildly depending on which 5 houses it looks at (High Variance).
2. The "Wrong Tool" Scenario
Imagine your data follows a complex, circular pattern (like a ring), but you try to fit it using a very short, jagged line segment.
- High Bias: A short line segment is way too simple to describe a circle. It will never "wrap around" the truth. It is fundamentally incapable of representing the shape.
- High Variance: Because the line segment is so short and "flexible" (it can point in any direction), it will pivot aggressively to chase the 2 or 3 dots nearest to it. If you change those dots slightly, the line flips upside down.
3. High-Dimensional "Noise"
In modern Machine Learning, this often happens when you have thousands of features but very few rows of data.
- High Bias: If none of those thousand features actually relate to the target, the model is "too simple" in terms of its predictive power (it's essentially guessing).
- High Variance: With so many dimensions to "wiggle" in, the model will find accidental, "fake" patterns in the noise (like "People whose name starts with B and own a kids always buy this product"). These fake patterns change completely every time you refresh the data.
- High Bias = The model is "blind" to the true pattern (Underfitting). It consistently misses the target.
- High Variance = The model is "distracted" by the noise (Overfitting). It lacks a consistent aim.