Understanding the Confusion Matrix and Model Evaluation Metrics
The Confusion Matrix is the cornerstone of model evaluation for classification problems. It gives us a detailed breakdown of how our model's predictions compare to the actual outcomes.
The Confusion Matrix
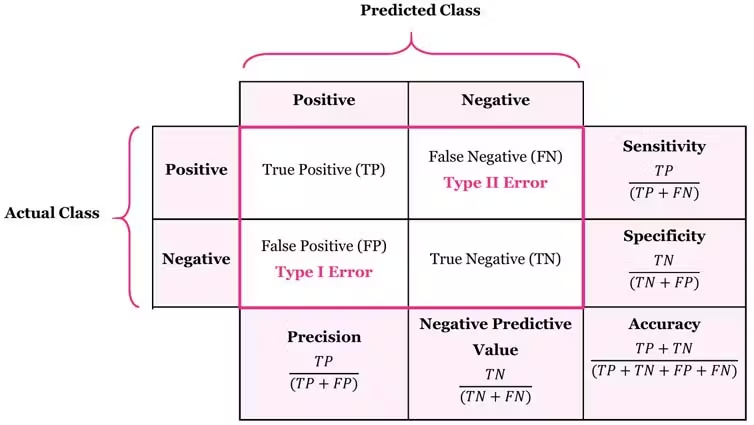
The confusion matrix is a table that summarizes the performance of a classification algorithm.
- True Positives (TP): You predicted a "Yes," and it was a "Yes." (Correct)
- True Negatives (TN): You predicted a "No," and it was a "No." (Correct)
- False Positives (FP): You predicted a "Yes," but it was a "No." (a "false alarm"). This is a Type I Error.
- False Negatives (FN): You predicted a "No," but it was a "Yes." (a "miss"). This is a Type II Error.
Example: COVID-19 Testing
Let's use a real-world example to make this concrete. Imagine we have a model that predicts whether a patient has COVID-19.
| Predicted: COVID-19 (1) | Predicted: Healthy (0) | |
|---|---|---|
| Actual: COVID-19 (1) | 126 (TP) | 118 (FN) |
| Actual: Healthy (0) | 7 (FP) | 349 (TN) |
Total Predictions: 126 + 118 + 7 + 349 = 600
Now, let's calculate the key performance metrics.
Core Evaluation Metrics
1. Accuracy
Question:
- Out of all predictions, what percentage was correct?
Explanation
- Accuracy is the most intuitive metric. It's the ratio of correct predictions to the total number of predictions.
- It provides an overall view of the model’s performance.
When to use it?
- Accuracy is a great metric when the classes in your dataset are balanced, which implies that equal importance is given to both the positive and negative classes.
- Accuracy is useful when the dataset is perfectly symmetrical, where values of FNs and FPs are almost identical, with similar costs.
When to be cautious:
- It can be misleading on imbalanced datasets. A model can achieve high accuracy by simply predicting the majority class, even if it fails to identify the minority class.
Formula
Example
- Question: What is the accuracy of the model in detecting COVID-19?
2. Precision
Question:
- Of all the instances predicted as positive, how many were actually positive?
Explanation
- Precision is a metric that evaluates the reliability of positive predictions made by a model.
- Precision helps in avoiding FPs, also known as type I errors.
- Example: FPs occur when the model predicts positive (e.g., disease) when the actual class is negative (e.g., healthy).
- In critical scenarios (e.g., medical diagnosis, fraud detection, spam detection), FPs can have severe consequences.
- High precision minimizes false alarms and ensures that positive predictions are trustworthy.
- Precision becomes crucial when classes are imbalanced. It helps prevent the overestimation of positive cases.
- It shares an inverse relationship with recall. Increasing precision often leads to lower "Recall" (and vice versa).
Formula
When to use it?
When the cost of a False Positive is high. For example, in spam detection, you want to be very sure an email is spam before you send it to the spam folder, to avoid missing important emails.
Example
Of all the patients the model flagged as having COVID-19, how many actually had it?
3. Recall (Sensitivity or True Positive Rate)
Question:
- Of all the actual positive cases, how many did the model capture?
Explanation
- Recall measures the model's ability to find all the actual positive cases. It is the proportion of correctly predicted positive observations.
- Recall is crucial when avoiding False Negatives (FNs) is a priority. Missing a positive case can have severe consequences in many scenarios.
Formula
When to use it?
-Recall is crucial when the cost of a False Negative is high and priority is when avoiding FNs.
- This metric plays a crucial role in areas such as medical diagnosis and quality control. When identifying diseases, missing a sick patient (a False Negative) can have severe consequences. Recall ensures that the actual positive cases are not overlooked.
- In quality control, for detecting defects or anomalies, recall helps identify all faulty products, minimizing FNs. Recall emphasizes the ability to find actual positive instances.
Example
- Question: Of all the patients who actually had COVID-19, how many did the model correctly identify?
4. Recall (Specificity or True Negative Rate)
Question:
- Of all the negative cases, how many did the model correctly identify>
Explanation
- Specificity is the "recall" for the negative class. It measures the proportion of actual negatives that are correctly identified as such.
- Specificity measures how many of the actual negatives were correctly identified.
Formula
When to use it?
- When you want to be sure about your negative predictions. In our example, a high specificity means the model is good at confirming who is healthy.
Example
- Question: Of all the healthy patients, how many did the model correctly identify?
5. F1-Score
Question:
- How can we get a single score that balances Precision and Recall?
Explanation
- The F1-score is the harmonic mean of Precision and Recall.
- It's a great metric for imbalanced datasets because it takes both False Positives and False Negatives into account, providing a single metric that considers both.
Formula
When to use it?
- When you have imbalanced classes and you need a balance between catching everyone (Recall) and being right when you do (Precision). It’s the "Safety first, but be accurate" metric. (you care about both FPs and FNs.)
Limitations
- It only uses Precision and Recall, which don't include True Negatives, meaning F1-Score focuses purely on the Positive class and does not include True Negatives in its calculation.
Example
- Question: What is the F1-Score for the COVID-19 detection model?
Advanced Evaluation Techniques
1. ROC Curve and AUC
★ ROC (Receiver Operating Characteristic curve)
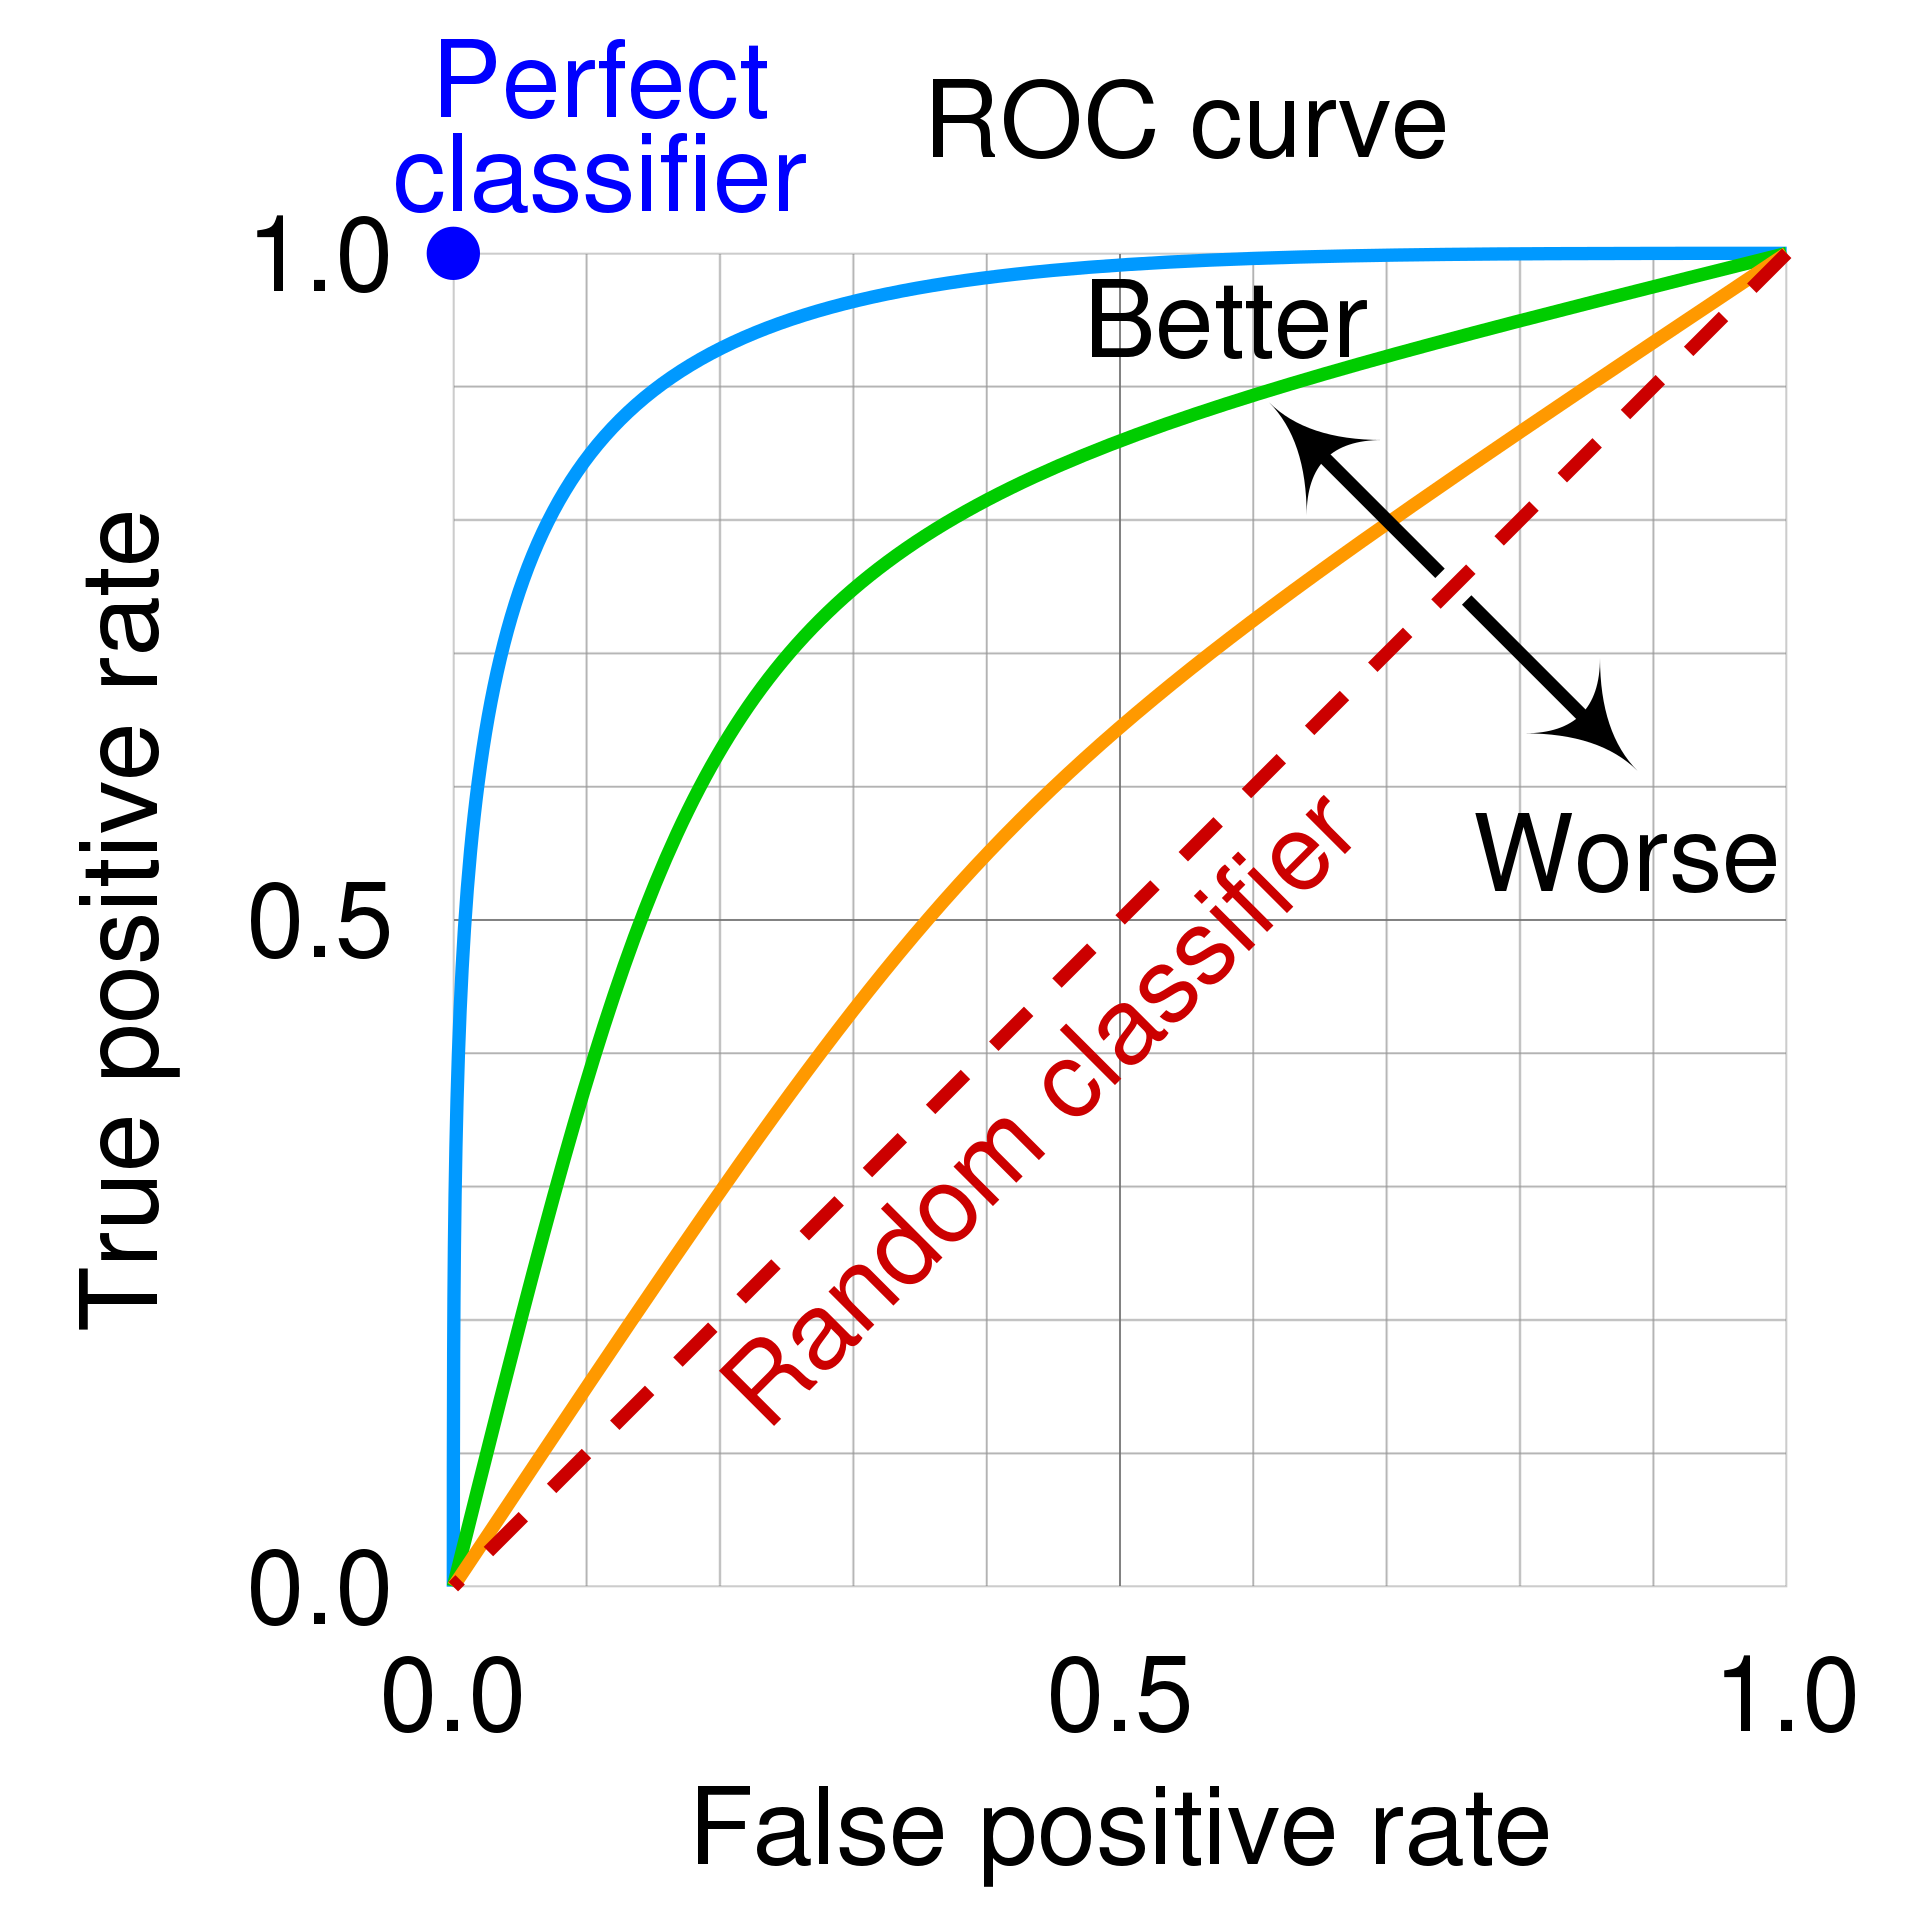
The Receiver Operating Characteristic (ROC) curve is a graph showing the performance of a classification model at all classification thresholds.
- 👉 The ROC curve is drawn by calculating the True Positive Rate (Recall/Sensitivity) and False Positive Rate (1 - Specificity) (FPR) for different threshold for binary classification, then graphing TPR over FPR.
- True Positive Rate ➛
- False Positive Rate ➛
- True Positive Rate ➛
★ AUC (Area under the ROC curve)
- A number between 0.0 and 1.0 representing a binary classification model's ability to separate positive classes from negative classes. The closer the AUC is to 1.0, the better the model's ability to separate classes from each other.
- This is the area under the ROC curve. It provides a single number to summarize the model's performance across all thresholds.
- AUC = 1: Perfect model.
- AUC = 0.5: A model that is no better than random guessing.
- AUC < 0.5: A model that is worse than random guessing.
- Curve Position: A model with better predictive power follows the top-left border of the graph
- Diagonal Line: A 45-degree diagonal line represents a random classifier; curves closer to the top-left indicate better accuracy, while those near the diagonal indicate poor performance.
★ ROC curve at different Threshold
| Classification threshold | ROC curve | TP FN FP TN |
Scores |
|---|---|---|---|
| Threshold:0.5 If the costs are roughly equivalent, point B may offer the best balance between TPR and FPR. !600 |
!200 | 40 8 7 44 |
Accuracy 0.85 Precision 0.85 Recall 0.83 |
| Threshold:0.35 If false positives (false alarms) are highly costly, lower threshold that gives a lower FPR, even if TPR is reduced !600 |
!200 | 46 2 17 34 |
Accuracy 0.81 Precision 0.73 Recall 0.96 |
| Threshold:0.65 If false positives are cheap and false negatives (missed true positives) highly costly, then higher threshold maximizes TPR !600 |
!200 | 27 21 1 50 |
Accuracy 0.78 Precision 0.96 Recall 0.56 |
★ Limitations
- Class Imbalance: If the number of positive and negative cases is extremely low or imbalanced, the interpretation of the curve can be less reliable.
- Dependent on Thresholds: The curve shows performance trade-offs, but selecting the single "best" point depends on the cost of false positives vs. false negatives.
2. Precision-Recall Curve and AUC
AUC and ROC work well for comparing models when the dataset is roughly balanced between classes.
- The Precision-Recall (PR) curve are created by plotting Precision on the y-axis versus Recall on the x-axis for different thresholds.
- It is particularly useful for imbalanced datasets where the positive class is rare.
- AUC-PR: The area under the PR curve. A higher AUC-PR indicates a better model.
3. Cumulative Gain and Lift Curves
These curves are used to evaluate how well a model segments the population.
- Cumulative Gains Curve: It shows the percentage of positive outcomes captured by a certain percentage of the population, sorted by predicted probability. A good model will have a steep curve, indicating it identifies positive cases early.
- Lift Curve: It measures how much better the model is than random guessing. A lift of 3x at the 10% mark means that by targeting the top 10% of the population according to the model, you will reach 3 times more positive cases than if you selected 10% randomly.
Python Example: Plotting Evaluation Metrics
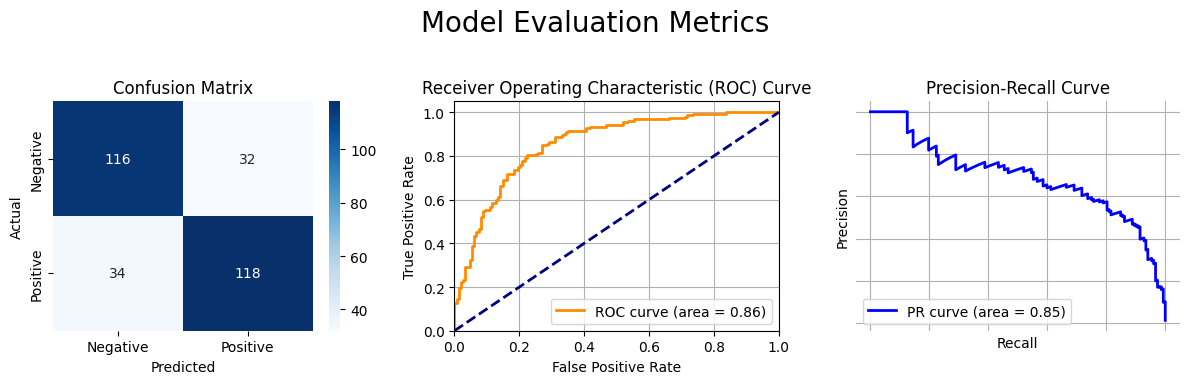
Here is a Python code snippet that demonstrates how to generate and plot a Confusion Matrix, ROC Curve, and Precision-Recall Curve for a binary classification model using scikit-learn, seaborn, and matplotlib.
➛ Snippets Only
Plot 1: Confusion Matrix
cm = confusion_matrix(y_test, y_pred)
sns.heatmap(cm, annot=True, fmt='d', cmap='Blues', ax=axes[0, 0],
            xticklabels=['Predicted Negative', 'Predicted Positive'],
            yticklabels=['Actual Negative', 'Actual Positive'])
Plot 2: ROC Curve
fpr, tpr, _ = roc_curve(y_test, y_pred_proba)
roc_auc = roc_auc_score(y_test, y_pred_proba)

axes[1].plot(fpr, tpr, color='darkorange', lw=2, label=f'ROC curve (area = {roc_auc:.2f})')
Plot 3: Precision-Recall Curve
precision, recall, _ = precision_recall_curve(y_test, y_pred_proba)
pr_auc = auc(recall, precision)

axes[2].plot(recall, precision, color='blue', lw=2, label=f'PR curve (area = {pr_auc:.2f})')
Plot 4: Evaluation Matrix
from sklearn.metrics import classification_report

# The variables `cm`, `y_test`, and `y_pred` are from the previous cell.

# --- Calculate Metrics from Confusion Matrix ---
# cm is structured as: [[TN, FP], [FN, TP]]
TN, FP, FN, TP = cm.ravel()

# 1. Accuracy: (TP + TN) / Total
# Overall, how often is the classifier correct?
accuracy = (TP + TN) / (TP + TN + FP + FN)

# 2. Recall (Sensitivity or True Positive Rate): TP / (TP + FN)
# Of all the actual positive cases, how many did the model correctly identify?
recall = TP / (TP + FN)

# 3. Specificity (True Negative Rate): TN / (TN + FP)
# Of all the actual negative cases, how many did the model correctly identify?
specificity = TN / (TN + FP)

# 4. Precision: TP / (TP + FP)
# Of all the cases the model predicted as positive, how many were actually positive?
precision = TP / (TP + FP)

# 5. F1-Score: 2 * (Precision * Recall) / (Precision + Recall)
# The harmonic mean of Precision and Recall, providing a single score that balances both.
f1_score = 2 * (precision * recall) / (precision + recall)

print("--- Calculated Manually from Confusion Matrix ---")
print(f"Accuracy:             {accuracy:.4f}")
print(f"Precision:            {precision:.4f}")
print(f"Recall (Sensitivity): {recall:.4f}")
print(f"Specificity:          {specificity:.4f}")
print(f"F1-Score:             {f1_score:.4f}")

print("\n" + "="*50 + "\n")

# --- Using sklearn's classification_report for a comprehensive summary ---
# This is the recommended and standard way to get these metrics.
print("--- Using sklearn.metrics.classification_report ---")
# 'support' is the number of actual occurrences of each class in y_test.
print(classification_report(y_test, y_pred, target_names=['Negative (0)', 'Positive (1)']))
--- Calculated Manually from Confusion Matrix ---
Accuracy:                0.7800
Precision:                0.7867
Recall (Sensitivity): 0.7763
Specificity:              0.7838
F1-Score:                0.7815

==================================================

--- Using sklearn.metrics.classification_report ---
              precision    recall  f1-score   support

Negative (0)       0.77      0.78      0.78       148
Positive (1)         0.79      0.78      0.78       152

	accuracy                                  0.78       300
   macro avg        0.78      0.78      0.78      300
weighted avg       0.78      0.78     0.78       300
Scenarios: Choosing the Right Metric
1. Cancer Detection:
- Goal: Identify patients with cancer.
- Critical Error: A False Negative (missing a cancer case) is catastrophic.
- Metric to Optimize: Recall. We want to find all the cancer patients, even if it means some healthy patients are incorrectly flagged for more tests (higher FPs).
2. Email Spam Filtering
- Goal: Move spam emails to the spam folder.
- Critical Error: A False Positive (a legitimate email is marked as spam) is very bad.
- Metric to Optimize: Precision. We want to be very sure an email is spam before filtering it.
3. Credit Card Fraud Detection
- Goal: Detect fraudulent transactions.
- Dataset: Highly imbalanced (most transactions are not fraudulent).
- Critical Error: A False Negative (letting a fraudulent transaction go through) is costly.
- Metric to Optimize: Recall is very important, but you also don't want to block too many legitimate transactions (FPs). F1-Score or the Precision-Recall Curve are excellent choices here.
4. Customer Churn Prediction
- Goal: Identify customers who are likely to cancel their subscription.
- Action: Offer a discount to retain them.
- Critical Error: False Positives (offering discounts to happy customers) cost money. False Negatives (failing to identify a churning customer) lose revenue.
- Metric to Optimize: F1-Score to balance the cost of FPs and FNs. A Lift Curve can also be very useful to see how effectively you can target at-risk customers.
5. Loan Application Approval
- Goal: Decide whether to approve a loan.
- Critical Error: A False Positive (approving a loan for someone who will default) is very costly.
- Metric to Optimize: Precision. You want to be confident that the loans you approve will be paid back.
6. Predicting Equipment Failure in a Factory
- Goal: Predict when a machine will fail so maintenance can be scheduled.
- Critical Error: A False Negative (failing to predict a failure) can lead to costly downtime and repairs.
- Metric to Optimize: Recall. It's better to do a few unnecessary maintenance checks (FPs) than to have a machine break down unexpectedly.
7. A/B Testing for a Website Redesign
- Goal: Determine if a new website design leads to more user sign-ups.
- Dataset: Likely balanced.
- Metric to Optimize: Accuracy. Here, both classes (signed up / did not sign up) are of equal interest.
8. Hiring: Screening Resumes
- Goal: Identify qualified candidates from a large pool of applicants.
- Critical Error: A False Negative (rejecting a qualified candidate) means losing talent.
- Metric to Optimize: Recall. You want to make sure all good candidates make it to the next round, even if it means reviewing a few unqualified ones.
9. Content Recommendation (e.g., Netflix)
- Goal: Recommend movies a user will like.
- Critical Error: A False Positive (recommending a movie the user hates) is a poor user experience.
- Metric to Optimize: Precision. You want your recommendations to be relevant and liked by the user.
10. Self-Driving Car: Pedestrian Detection
- Goal: Detect pedestrians to avoid collisions.
- Critical Error: A False Negative (failing to detect a pedestrian) is the worst possible outcome.
- Metric to Optimize: Recall. The system must detect every single pedestrian, even if it sometimes creates false alarms (FPs) by flagging inanimate objects.
11. Detecting Rare disease
- Goal: A medical diagnostic test for a rare disease is being evaluated. Which test is best the context of this diagnostic test?
- Critical Error: False Negative - This would be catastrophic if we miss detecting any patient with rare disease.
- Metric to Optimize: Recall (Sensitivity): High recall is important in medical diagnostics because it ensures that a large proportion of individuals with the disease are correctly diagnosed, minimizing the risk of false negatives and ensuring appropriate medical intervention. Therefore, in the context of medical diagnostics, achieving high recall is often a priority to ensure the effectiveness of the diagnostic test in identifying
11. ROC Curve Perfect Classifier
- Question: The Receiver Operating Characteristic (ROC) curve plots the true positive rate (sensitivity) against the false positive rate (1-specificity). What does a point on the ROC curve with a true positive rate of 1 and a false positive rate of 0 represent?
- Critical Insight: This represents the top-left corner of the ROC space, where the model captures all positives without any false alarms.
- Answer: A perfect classification model. The model has 100% sensitivity (catches all positives) and 0% false positive rate (no false alarms).
12. Threshold Adjustment Effects
- Question: For a binary classification problem, a model has a precision of 0.8 and a recall of 0.6. If the model's decision threshold is decreased, which of the following scenarios is the most likely outcome?
- Critical Insight: Lowering the threshold makes the model predict "positive" more often, which increases recall (catches more positives) but decreases precision (more false positives).
- Answer: Precision will decrease, and recall will increase. This is the classic precision-recall trade-off.
13. Imbalanced Dataset Metrics
- Question: In a highly imbalanced dataset with a binary classification problem, which of the following combinations of metrics would be MOST appropriate to evaluate the model's performance?
- Critical Insight: Accuracy is misleading on imbalanced data. Metrics that focus on the minority class and ignore true negatives are more informative.
- Answer: Precision, Recall, and Area Under the Precision-Recall Curve (AUPRC). These metrics focus on the positive (minority) class performance.
14. Virus Detection Priority
- Question: Which metric would you prioritize if you were building a model to detect a highly contagious but treatable virus, where missing a case (False Negative) is dangerous?
- Critical Error: A False Negative (missing an infected person) allows the virus to spread.
- Metric to Optimize: Recall (Sensitivity). You must catch every infected person, even if it means some false alarms (healthy people flagged as infected).
15. Harmonic Mean vs Arithmetic Mean
- Question: Why is the F1-Score calculated using the Harmonic Mean rather than the Arithmetic Mean?
- Critical Insight: The harmonic mean severely penalizes imbalanced values, preventing a model with high precision but low recall (or vice versa) from getting a deceptively good score.
- Answer: It punishes extreme values in either Precision or Recall. The harmonic mean drops significantly if even one component is very low, preventing a 'good' score for an imbalanced model.
16. Email Spam Filter: Protecting Legitimate Emails
- Goal: Filter spam while ensuring important work emails are not mistakenly marked as spam.
- Critical Error: A False Positive (marking a legitimate email as spam) means missing important communications.
- Metric to Optimize: Precision. High precision ensures that when the model says "spam," it is almost certainly spam, protecting legitimate emails.
17. ROC-AUC Score of 0.5
- Question: An ROC-AUC score of 0.5 suggests that the model is:
- Critical Insight: AUC of 0.5 means the model's predictions are no better than random chance.
- Answer: Performing no better than random guessing. An AUC of 0.5 means the model has no discriminative power, equivalent to flipping a coin.
18. Specificity-Sensitivity Trade-off
- Question: If you increase the Specificity of a model, what is the most likely secondary effect?
- Critical Insight: Specificity and Sensitivity have an inverse relationship due to threshold adjustments.
- Answer: Sensitivity will likely decrease. Increasing specificity usually involves raising the threshold, which makes it harder for true positives to be caught (decreasing sensitivity).
19. Imbalanced Dataset (95% Negative Class)
- Question: Which evaluator is most appropriate for a dataset where 95% of samples belong to the 'Negative' class and catching the 'Positive' class is the priority?
- Critical Insight: Accuracy and Specificity focus on the majority (negative) class. We need metrics that focus on the minority (positive) class.
- Answer: F1-Score. The F1-Score ignores True Negatives and focuses on how well the model handles the minority (Positive) class.
20. Zero False Positives
- Question: If a Confusion Matrix has zero False Positives (FP = 0), what can we conclude?
- Critical Insight: $$\begin{align*} \large \text{Precision} = \frac{TP}{TP + FP} \end{align*}$$
- If FP is 0, Precision = TP / TP = 1.0
- Answer: Precision is 1.0. Every positive prediction was correct, though we don't know if all actual positives were caught (that's Recall).
21. False Alarm Classification
- Question: Which error type is a 'False Alarm'?
- Critical Insight: A false alarm occurs when you predict something is there when it isn't.
- Answer: Type I Error (False Positive). A False Positive occurs when you predict something is present when it isn't, like a smoke detector going off for no reason.
22. Loan Default Prediction
- Goal: Predict loan defaults while balancing the need to catch bad loans and not reject good customers.
- Critical Trade-off: The bank wants to avoid losing money (catch defaulters) but also doesn't want to lose good customers (avoid over-rejection).
- Metric to Optimize: F1-Score. The F1-score balances the need to catch bad loans (Recall) while ensuring the bank doesn't over-reject good customers (Precision).
23. Random Model ROC Curve
- Question: What happens to the ROC curve if a model's predictions are purely based on random chance?
- Critical Insight: In a random model, increasing True Positive Rate increases False Positive Rate at the same rate.
- Answer: It follows a 45-degree diagonal line. The True Positive Rate increases at the exact same rate as the False Positive Rate, creating a diagonal from (0,0) to (1,1).
24. High Recall, Low Precision Interpretation
- Question: If your model has a Recall of 1.0 but a Precision of 0.1, what does it indicate?
- Critical Insight: Recall = 1.0 means all actual positives are caught. Precision = 0.1 means most predictions are false positives.
- Answer: The model is predicting 'Positive' for almost everything. By predicting 'Yes' for every case, you catch all actual positives (Recall=1) but create many false alarms (low Precision).
25. Minimizing False Negatives
- Question: If you are trying to minimize 'False Negatives,' which metric should you maximize?
- Critical Insight: $$\large \text{Recall}=\frac{TP}{TP + FN} $$
- Metric to Optimize: Recall. Recall increases as False Negatives decrease, ensuring all actual positives are caught.
26. Precision-Recall Curve vs ROC Curve
- Question: What is the primary advantage of using a Precision-Recall (PR) Curve over an ROC Curve for imbalanced datasets?
- Critical Insight: ROC uses False Positive Rate which includes True Negatives. In imbalanced datasets, the large number of True Negatives can make the ROC curve look deceptively good.
- Answer: It does not include True Negatives, which can dominate the ROC Curve. PR curves focus only on the minority (Positive) class performance.
27. Error Rate Calculation
- Question: How do you calculate the 'Error Rate' from a Confusion Matrix?
- Answer: Error Rate is the sum of all incorrect predictions (False Positives + False Negatives) divided by the total number of samples.
28. High ROC-AUC but Low Accuracy
- Question: A model has a high ROC-AUC but low Accuracy. How is this possible?
- Answer: AUC measures performance across all possible thresholds, while Accuracy depends on a single threshold choice.
29. ROC Curve X-Axis
- Question: In the context of the ROC Curve, what is '1 - Specificity' equal to?
- Critical Insight: Specificity = TN / (TN + FP). Therefore, 1 - Specificity = FP / (FP + TN)
- Answer: False Positive Rate. The X-axis of the ROC curve is the False Positive Rate, calculated as FP / (FP + TN), which equals 1 - Specificity.
30. Pre-Trial Detention Decision
- Goal: Determine if someone should stay in jail before trial, being extremely careful not to jail an innocent person.
- Critical Error: A False Positive (predicting guilty when innocent) means wrongfully jailing an innocent person.
- Metric to Optimize: Precision. High precision ensures that if you predict someone is 'guilty/dangerous,' you are almost certainly correct, minimizing innocent jailing.
31. Type 1 Error and Type II error
★ Which of the following best describes the relationship between Type I error and specificity?
★ Which of the following statements is true regarding Type I and Type II errors?
★ In a factory, a quality control system checks products for defects before they are shipped. The system is designed to minimize the shipment of defective products to customers. Which type of error is more critical to minimize in this scenario?